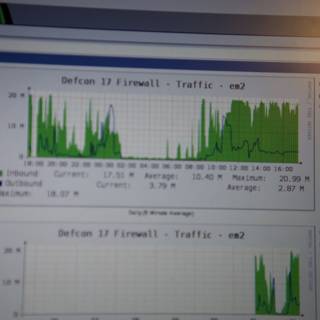
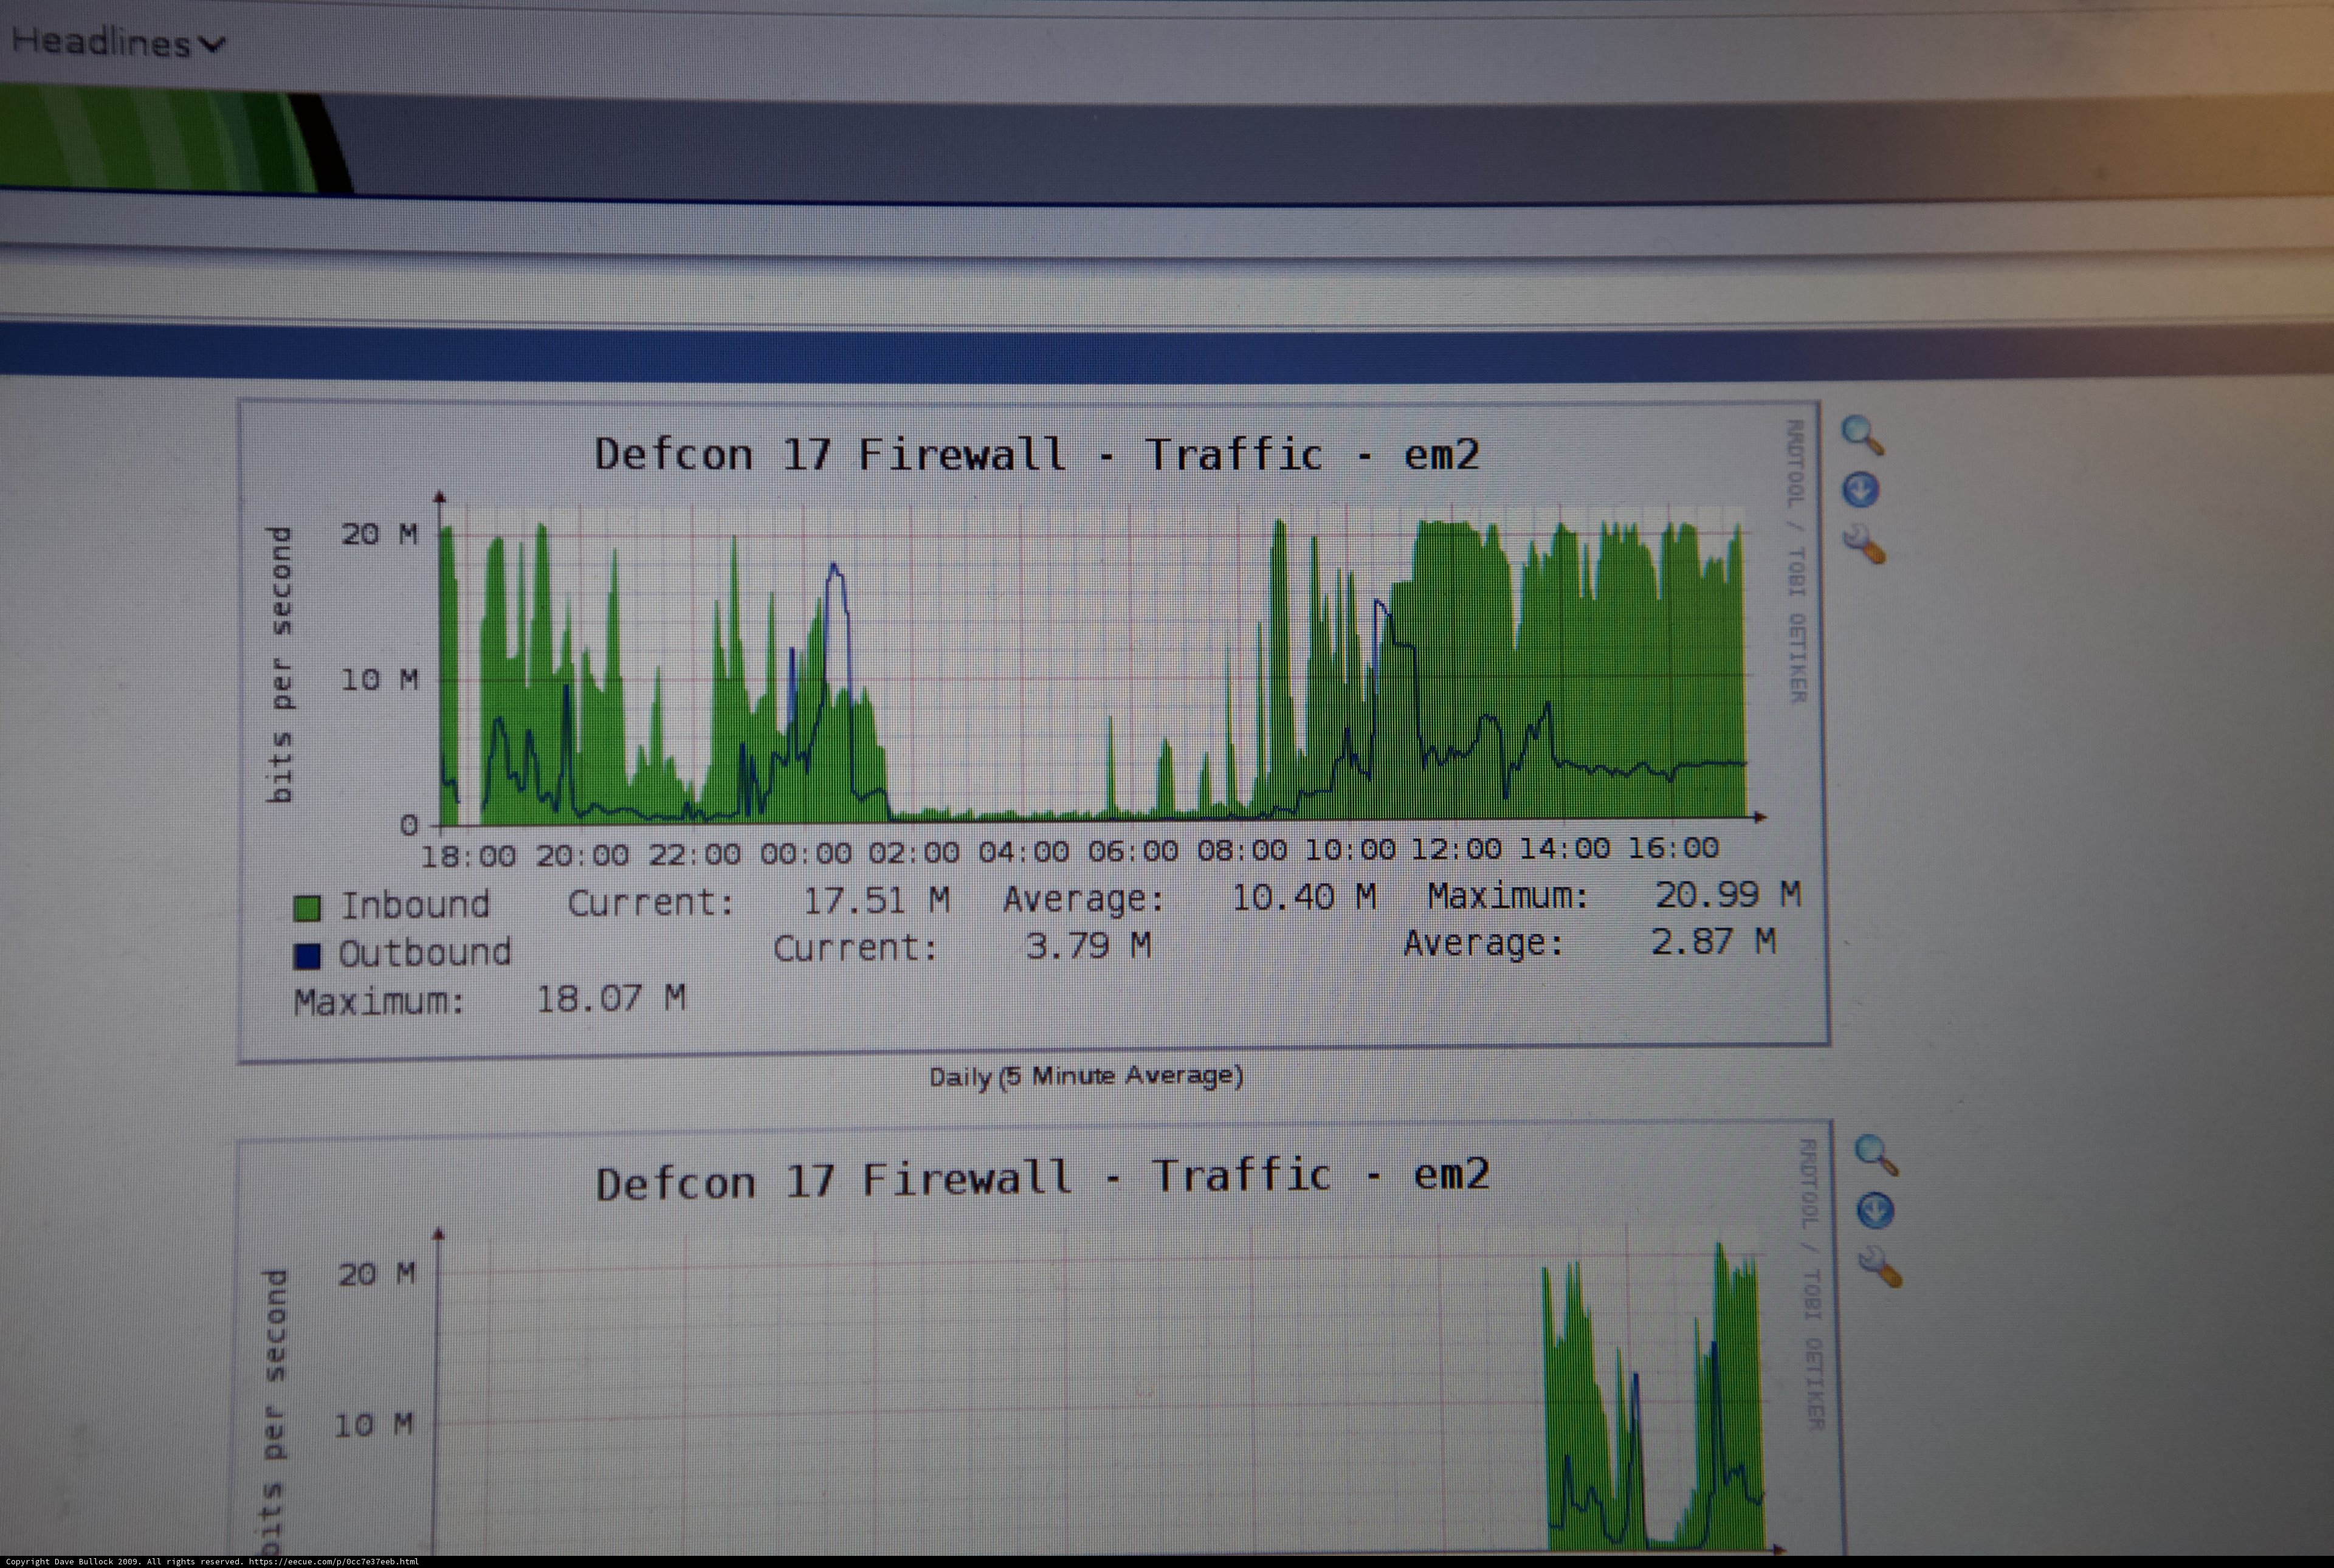
Photos | Traffic Graph Analysis at DEFCON 17
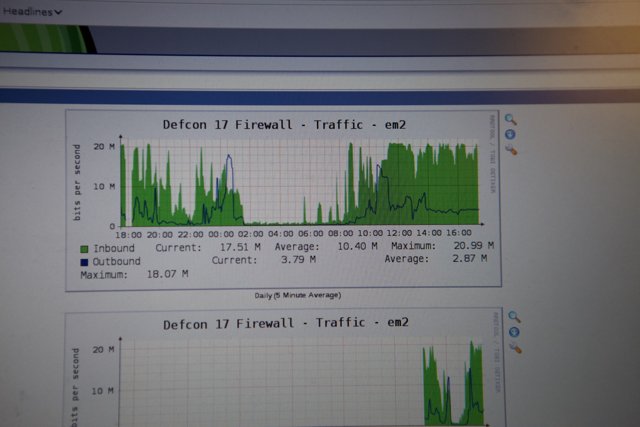
A computer screen displays a chart documenting traffic data analyzed on a white board during DEFCON 17 in 2009.
BLIP-2 Description:
a computer screen showing the traffic graphChronologically Adjacent
Note: You can also navigate with your arrow keys or swiping.
Metadata
Capture date:
Original Dimensions:
5616w x 3744h - (download 4k)
Usage
Dominant Color:
Detected Text
iso
1600
metering mode
5
aperture
f/3.2
focal length
70mm
shutter speed
1/1250s
camera make
Canon
camera model
lens model
curation
(25.00%)
highlight visibility
(1.98%)
behavioral
(10.02%)
failure
(-0.51%)
harmonious color
(-0.99%)
immersiveness
(0.10%)
interaction
(1.00%)
interesting subject
(-91.16%)
intrusive object presence
(-3.64%)
lively color
(7.42%)
low light
(0.39%)
noise
(-8.57%)
pleasant camera tilt
(-14.27%)
pleasant composition
(-31.86%)
pleasant lighting
(-24.60%)
pleasant pattern
(3.69%)
pleasant perspective
(-1.40%)
pleasant post processing
(-2.68%)
pleasant reflection
(-10.82%)
pleasant symmetry
(0.66%)
sharply focused subject
(0.73%)
tastefully blurred
(-1.68%)
well chosen subject
(-3.42%)
well framed subject
(14.42%)
well timed shot
(-4.19%)
all
(-5.39%)
* WARNING: The title and caption of this image were generated by an AI LLM (gpt-3.5-turbo-0301
from
OpenAI)
based on a
BLIP-2 image-to-text labeling, tags,
location,
people
and album metadata from the image and are
potentially inaccurate, often hilariously so. If you'd like me to adjust anything,
just reach out.