Photos | Technical Chart Analysis
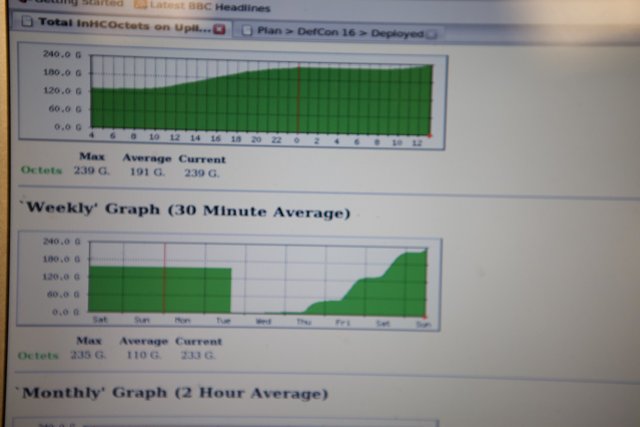
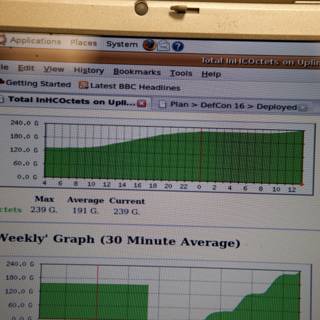
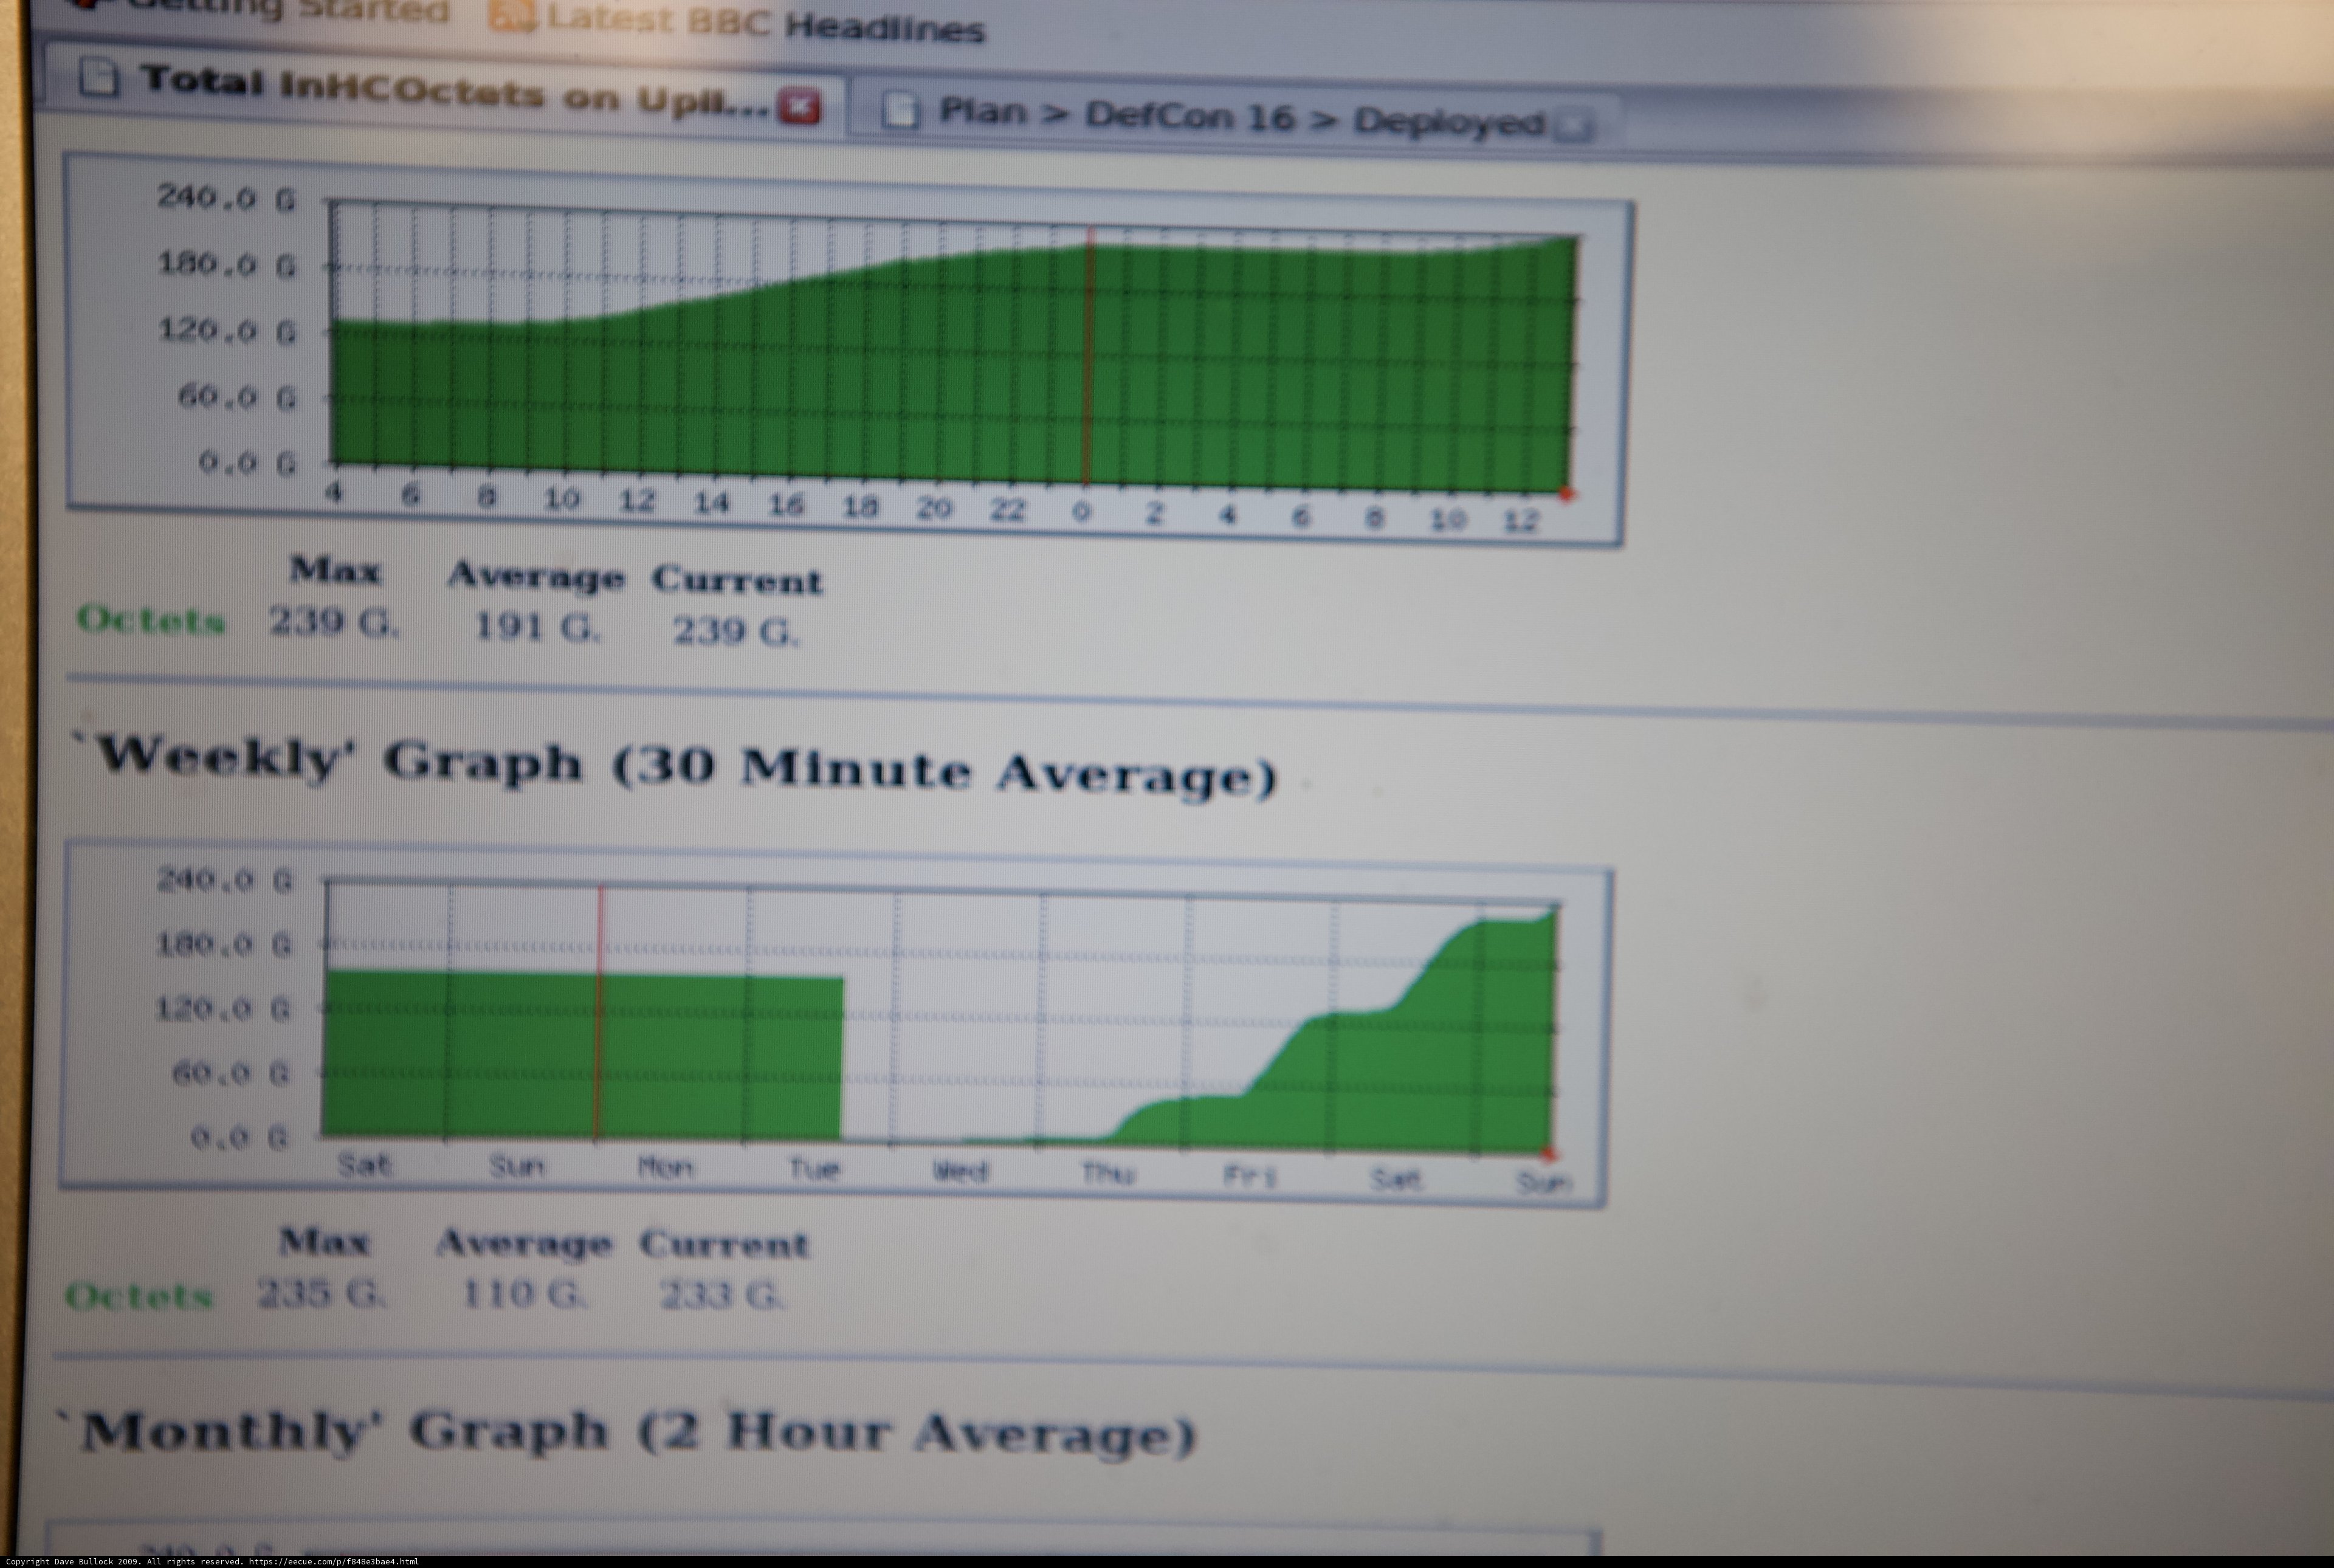
A computer screen displays a detailed chart documenting hardware and electronics data, from the 2009 Defcon 17 conference.
BLIP-2 Description:
a computer screen showing the graph of the graphChronologically Adjacent
Note: You can also navigate with your arrow keys or swiping.
Metadata
Capture date:
Original Dimensions:
5616w x 3744h - (download 4k)
Usage
Dominant Color:
ii plot plan current negative octets tue sun eos latest hour canon apple ml headlines document hardware average say electronics diagram mark defcon mon max line august upil graph monthly headlifes g incoctets inhcoctets deployed screen sac wed bbc minute sat summer chart total monitor computer weekly
Detected Text
iso
1600
metering mode
5
aperture
f/2.8
focal length
70mm
shutter speed
1/500s
camera make
Canon
camera model
lens model
curation
(25.00%)
highlight visibility
(1.98%)
behavioral
(10.01%)
failure
(-0.76%)
harmonious color
(-0.15%)
immersiveness
(0.10%)
interaction
(1.00%)
interesting subject
(-91.55%)
intrusive object presence
(-5.40%)
lively color
(6.96%)
low light
(0.02%)
noise
(-6.47%)
pleasant camera tilt
(-11.81%)
pleasant composition
(-32.74%)
pleasant lighting
(-28.96%)
pleasant pattern
(4.22%)
pleasant perspective
(-6.34%)
pleasant post processing
(-12.07%)
pleasant reflection
(-8.77%)
pleasant symmetry
(1.00%)
sharply focused subject
(0.68%)
tastefully blurred
(-6.99%)
well chosen subject
(12.04%)
well framed subject
(4.99%)
well timed shot
(-1.00%)
all
(-5.81%)
* WARNING: The title and caption of this image were generated by an AI LLM (gpt-3.5-turbo-0301
from
OpenAI)
based on a
BLIP-2 image-to-text labeling, tags,
location,
people
and album metadata from the image and are
potentially inaccurate, often hilariously so. If you'd like me to adjust anything,
just reach out.